Validated observations
Performance observations with clearly defined limits
The values on this page come from SHA-256-verified analysis records. They were obtained on one validated workstation using fixed input data and should not be interpreted as a general CPU/GPU performance comparison.
GPU alignment of the complete ERR188044 dataset
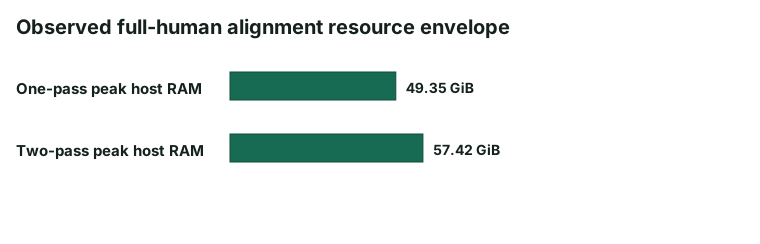
| Profile | Computational resources | Observed peak host memory | Observed peak VRAM | Isolated alignment time | Result |
|---|---|---|---|---|---|
| One-pass | 42 GB / 12 CPU cores | 52,991,762,432 B (49.35 GiB) | 11,598 MiB | Not measured separately | Completed successfully |
| Two-pass Basic | 96 GB / 12 CPU cores | 61,657,542,656 B (57.42 GiB) | 11,606 MiB | 850 s (14 min 10 s) | Completed successfully; cgroup peak 80,275,611,648 B |
These measurements were obtained on one validated workstation using one fixed public dataset. They are not a matched CPU STAR benchmark because Harako-RNAseq runs a different workflow, and they should not be interpreted as a general GPU speedup estimate.
Salmon runtime
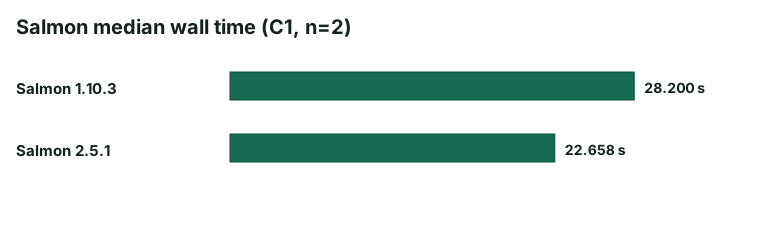
| Version | Median wall time | Repeatability |
|---|---|---|
| 1.10.3 | 28.1998923805 s | Repeated runs were highly concordant, but the numerical results were not identical. |
| 2.5.1 | 22.6584244570 s | Repeated runs produced identical numerical results. |
The observed median wall-time ratio for 1.10.3 relative to 2.5.1 was 1.2445654566. Because n=2, this should not be interpreted as a general performance estimate.
Agreement in abundance estimates between Salmon versions
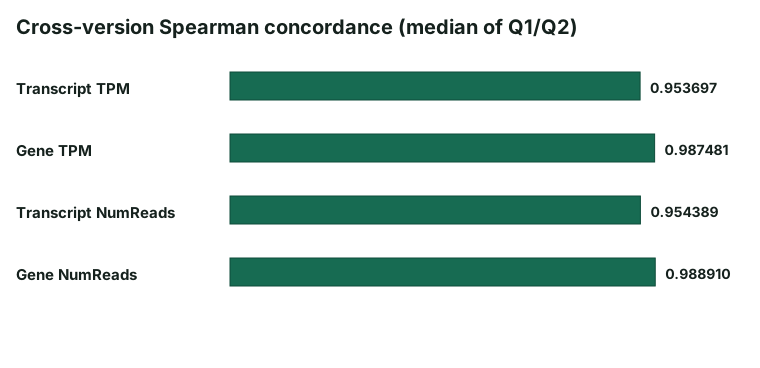
| Measure | Comparison run Q1 | Comparison run Q2 | Median |
|---|---|---|---|
| Transcript TPM | 0.9537426073 | 0.9536519157 | 0.9536972615 |
| Gene TPM | 0.9874856268 | 0.9874762280 | 0.9874809274 |
| Transcript estimated reads (NumReads) | 0.9544253338 | 0.9543532364 | 0.9543892851 |
| Gene estimated reads (NumReads) | 0.9889113990 | 0.9889087428 | 0.9889100709 |
Genes and transcripts affected by the Salmon version difference
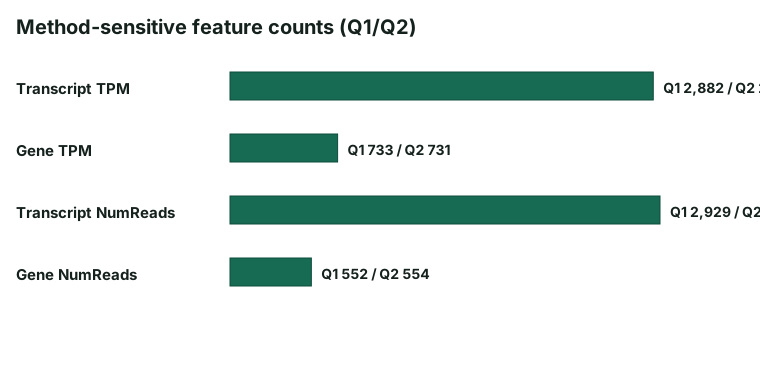
| Measure | Comparison run Q1 | Comparison run Q2 |
|---|---|---|
| Transcript TPM | 2,882 | 2,883 |
| Gene TPM | 733 | 731 |
| Transcript estimated reads (NumReads) | 2,929 | 2,925 |
| Gene estimated reads (NumReads) | 552 | 554 |
Salmon 2.5.1 is the default for new analyses. Salmon 1.10.3 remains available for compatibility with earlier analyses. Repeated 1.10.3 runs were highly concordant, but their numerical results were not identical. Results produced with different Salmon versions should not be combined without explicitly accounting for the version difference. Every run records the version, container image, index, options, and execution order.